 2014 Interactive Annual Report
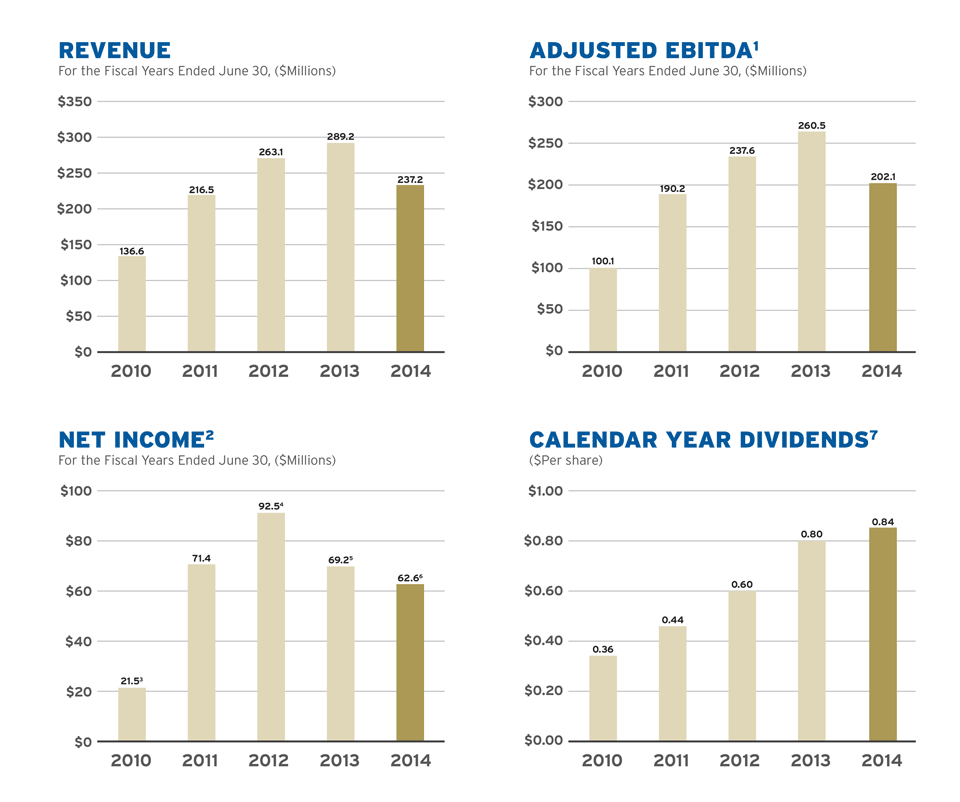
Selected Statements of Operations Data
| For the Fiscal Years Ended June 30, | ||||||||||
| (Amounts in thousands, except per share data) | 2014 | 2013 | 2012 | 2011 | 2010 | |||||
| Revenue | $ | 237,162 | $ | 289,224 | $ | 263,054 | $ | 216,469 | $ | 136,565 |
| Adjusted EBITDA 1 | $ | 202,070 | $ | 260,469 | $ | 237,616 | $ | 190,172 | $ | 100,068 |
| Operating income | $ | 108,720 | $ | 171,167 | $ | 156,634 | $ | 118,925 | $ | 41,035 |
| Net income | $ | 63,472 | $ | 73,409 | $ | 98,309 | $ | 77,299 | $ | 29,422 |
| Net income attributable to Royal Gold stockholders 3, 4, 5, 6 | $ | 62,641 | $ | 69,153 | $ | 92,476 | $ | 71,395 | $ | 21,492 |
| Net income per share available to Royal Gold common stockholders: | ||||||||||
| Basic | $ | 0.96 | $ | 1.09 | $ | 1.61 | $ | 1.29 | $ | 0.49 |
| Diluted | $ | 0.96 | $ | 1.09 | $ | 1.61 | $ | 1.29 | $ | 0.49 |
| Dividends declared per common share | $ | 0.83 | $ | 0.75 | $ | 0.56 | $ | 0.42 | $ | 0.34 |
Selected Balance Sheet Data
| As of June 30, | ||||||||||
| (Amounts in thousands) | 2014 | 2013 | 2012 | 2011 | 2010 | |||||
| Royalty interests in mineral properties, net | $ | 2,109,067 | $ | 2,120,268 | $ | 1,890,988 | $ | 1,690,439 | $ | 1,476,799 |
| Total assets | $ | 2,891,544 | $ | 2,905,341 | $ | 2,376,366 | $ | 1,902,702 | $ | 1,865,333 |
| Debt | $ | 311,860 | $ | 302,263 | $ | 293,248 | $ | 226,100 | $ | 248,500 |
| Total liabilities | $ | 518,987 | $ | 534,705 | $ | 512,937 | $ | 415,007 | $ | 431,785 |
| Total Royal Gold stockholders’ equity | $ | 2,354,725 | $ | 2,348,887 | $ | 1,838,459 | $ | 1,460,162 | $ | 1,403,716 |
- The term “Adjusted EBITDA” is a non-GAAP financial measure. Adjusted EBITDA is defined by the Company as net income plus depreciation, depletion and amortization, non-cash charges, income tax expense, interest and other expense, and any impairment of mining assets, less non-controlling interests in operating income of consolidated subsidiaries, interest and other income, and any royalty portfolio restructuring gains or losses.
- The term “net income” represents net income attributable to Royal Gold shareholders as shown on the Company’s Consolidated Statement of Operations and Comprehensive Income in our Annual Report on Form 10-K.
- Net income for FY2010 was impacted by pre-tax effects of severance and acquisition cost of $19.4 million, or $0.33 per share, related to the International Royalty Corporation transaction.
- Net income for FY2012 was impacted by a royalty restructuring charge at Relief Canyon resulting in a $0.02 loss per basic share after taxes.
- Net income for FY2013 was impacted by an impairment loss recognized on available-for-sale securities of $12.1 million, or $0.23 per basic share after taxes, in addition to increased depletion expense.
- Net income for FY2014 was impacted by an impairment loss recognized on available-for-sale securities of $4.5 million, or $0.07 per basic share after taxes.
- Dividends are paid on a calendar year basis and do not correspond with the fiscal year dividend amounts show in the Selected Financial Data. Fiscal 2014 dividends totaled $0.83 per share; calendar 2014 total includes the estimated fourth quarter dividend.