The Gold Market
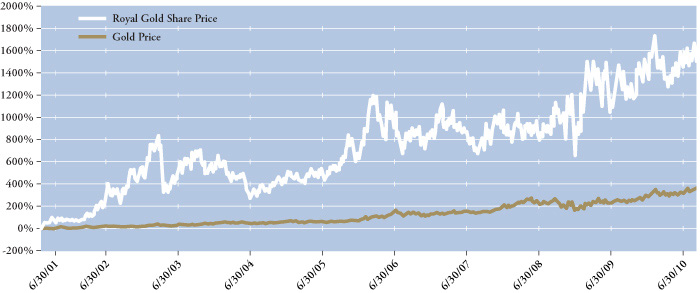
Royal Gold Ten-Year Price Performance Relative to the Gold Price
The Gold Market 1
Gold Price
The average gold price in calendar year 2009 increased 11.6% to $974.16 as the continued economic and political uncertainties, together with a further increase in investor demand and access to the physical gold markets, contributed to the eighth straight year of increased value. For Royal Gold’s fiscal year ended June 30, 2010, the gold price started the year at $938.25 and ended at $1,244.00. During this period, the London PM gold fixing reached an all-time high of $1,261.00 on June 28, 2010.
Calendar Year 2009
The positive performance for gold reflects the continued increases in investment demand and a shift in Central Bank investment flows. Private investors increased holdings by 37 million ounces of gold in 2009 and have added over 350 million ounces of gold since the current bull market began in 2001. Private investor holdings are estimated to be 1.16 billion ounces of gold at the end of 2009. However, the market value of gold held by private investors represents only 0.6% of global financial assets. Exchange traded funds (“ETFs”), which were first launched in 2004, have grown to approximately 15 in number and collectively owned 57 million ounces of gold at the end of 2009. In 2009 alone, the ETFs added 18 million ounces to their holdings. While private sector holdings were increasing, Central Banks added 15 million ounces to their reserves, the first year in which they have added ounces since 1988 and in direct contrast to average disposals of 12 million ounces per year over the last 20 years. The increases in Central Bank reserves offset the sale of 6 million ounces by the International Monetary Fund (“IMF”) to the Reserve Bank of India. Russia and China also saw reserve increases during the year. It is also interesting to note that Barrick Gold, the largest hedger of gold at one point in time, announced its plans to eliminate its gold hedge book of 9.5 million ounces. This was essentially completed in November 2009 at a cost of over $5 billion. Fabrication demand for gold fell in response to higher prices from 78 million ounces to 65 million ounces, of which 50 million ounces were attributable to jewelry manufacturing. In sum, total gold demand was 117 million ounces in 2009, 55% of which was attributable to fabrication requirements and the remainder to investment activity.
In terms of supply, mine production of 77 million ounces represented the largest portion of total gold supply of 117 million ounces, with the remainder provided by scrap or recycling. China was again the largest producer of gold, at over 10 million ounces, followed by the United States and Australia as the next two top producers. South Africa continued its decline. While three decades ago it was a producer of over 20 million ounces of gold, South Africa now produces less than 7.0 million ounces. The country ranked fourth in the world in terms of production. Despite a bull market for gold since 2001, and over $20 billion allocated to gold exploration since then, mine production now stands ten percent below the high of 86 million ounces at the turn of the millennium. While mine production lags, above ground stocks of gold are in excess of 160,000 tonnes, of which jewelry is estimated to be 50% of the figure, central bank reserves 20%, and the remainder is held by private investors and industry. The supply of gold in any year still only represents less than 3% of total stocks.
Six Months to June 30, 2010
In the first six months of 2010, the gold price continued to rise, increasing to an average of $1,153.00 versus an average price of $915.00 for the comparable period in 2009. Gold holdings through the ETFs rose to over 65 million ounces, much of that occurring in the second quarter as fiscal imbalances and debt concerns in certain European countries led a move to safety in gold and the U.S. dollar. Total demand was 58.9 million ounces, 14% below the same period in 2009, and was composed of jewelry (48%), other fabrication demand (23%) and investment demand (29%). While jewelry demand fell 5%, it is interesting to note that certain markets, such as Japan, China and Russia, actually saw demand increases despite higher prices. Total supply of gold was 65 million ounces, down 6% from the same period last year as higher mine production was more than offset by a 13% fall in supply from recycling. Official sector activity was due primarily to the IMF’s continuing gold sale program. As of September 2010, the IMF had sold 222 tonnes to central banks (India, Bangladesh, Sri Lanka and Mauritius) with another 88 tonnes sold on a market basis. Less than 100 tonnes remains to be sold under the IMF’s program. Also, selling by Central Banks under the Central Bank Gold Agreement has remained nominal through the first six months of 2010 despite a 400 tonne limit. All official sector activity contributed to a net increase in gold holdings by Central Banks of 1.5 million ounces. Excluding the IMF, the top five Central Bank gold owners are the United States, Germany, Italy, France and China. While the first four of these countries hold gold that, on average, equals 68% of reserves, China’s total holdings represent less than 2% of the total reserves.
Organizational Involvement
Royal Gold is an active participant in organizations involved in promoting the mining industry and the use of gold. The Company is a member of the World Gold Council, and is represented by its President and Chief Executive Officer on the board of the National Mining Association, and by its Vice President of Operations on the board of the Nevada and Colorado Mining Associations.
For more information on gold, you can visit the following web sites:
World Gold Council - www.gold.org
National Mining Association - www.nma.org
Nevada Mining Association - www.nevadamining.org
Colorado Mining Association – www.coloradomining.org
Minerals Information Institute – www.mii.org
1 This information is derived from various industry sources, including the CPM Group and the World Gold Council, and represents the data and opinions of those sources. Royal Gold has not verified this data and presents this information as a representative overview of views on the gold business from gold industry sources. No assurance can be given that this data or these opinions will prove accurate. Investors are urged to reach their own conclusions regarding the gold market.