Financial Highlights
Royalty Revenue
For the Fiscal Years Ended June 30
($ Millions)
Net Income
For the Fiscal Years Ended June 30
($ Millions)
Free Cash Flow 1
For the Fiscal Years Ended June 30
($ Millions)
Calendar Year Dividends 2
Dollars per share
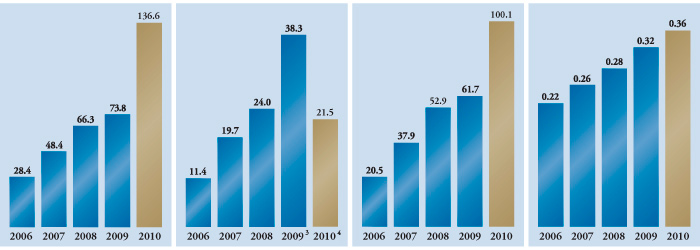
1 The term “free cash flow” is a non-GAAP financial measure. Free cash flow is defined by the Company as operating income plus depreciation, depletion and amortization, non-cash charges and impairment of mining assets, if any, less non-controlling interests in operating income from consolidated subsidiaries. See page 26 for a GAAP reconciliation.
2 Dividends are paid on a calendar year basis and do not correspond with the fiscal year dividend amounts shown in the Selected Financial Data.
3 Net income attributable to Royal Gold shareholders for FY2009 was impacted by two one-time gains related to the Barrick royalty portfolio acquisition and the Benso royalty buy-back by Golden Star. The effect of these gains was $0.62 per basic share after taxes.
4 Net income attributable to Royal Gold shareholders for FY2010 was impacted by pre-tax effects of severance and acquisition costs of $19.4 million, or $0.33 per share, related to the International Royalty Corporation transaction.
| Selected statements of Operations Data | For the Fiscal Years Ended June 30, | |||||||||
| (Amounts in thousands, except per share data) | 2010 | 2009 | 2008 | 2007 | 2006 | |||||
| Royalty revenue | $ | 136,565 | $ | 73,771 | $ | 66,297 | $ | 48,357 | $ | 28,380 |
| Free cash flow 1 | $ | 100,068 | $ | 61,706 | $ | 52,863 | $ | 37,916 | $ | 20,451 |
| Operating income | $ | 41,035 | $ | 27,292 | $ | 32,982 | $ | 28,506 | $ | 13,412 |
| Net income | $ | 29,422 | $ | 41,357 | $ | 25,395 | $ | 21,242 | $ | 11,350 |
| Net income attributable to Royal Gold stockholders | $ | 21,492 | $ | 38,348 | $ | 24,043 | $ | 19,720 | $ | 11,350 |
| Net income available to Royal Gold common stockholders | $ | 21,492 | $ | 38,348 | $ | 19,255 | $ | 19,720 | $ | 11,350 |
| Net income per share available to Royal Gold common stockholders: | ||||||||||
| Basic | $ | 0.49 | $ | 1.09 | $ | 0.62 | $ | 0.79 | $ | 0.5 |
| Diluted | $ | 0.49 | $ | 1.07 | $ | 0.61 | $ | 0.79 | $ | 0.49 |
| Dividends declared per common share 2 | $ | 0.34 | $ | 0.3 | $ | 0.28 | $ | 0.25 | $ | 0.22 |
| Selected Balance Sheet Data | For the Fiscal Years Ended June 30, | |||||||||
| (Amounts in thousands, except per share data) | 2010 | 2009 | 2008 | 2007 | 2006 | |||||
| Total assets | $ | 1,861,333 | $ | 809,924 | $ | 545,850 | $ | 356,649 | $ | 171,765 |
| Royalty interests in mineral properties, net | $ | 1,467,983 | $ | 455,966 | $ | 300,670 | $ | 215,839 | $ | 84,590 |
| Long-term debt, including current portion | $ | 248,500 | $ | 19,250 | $ | 15,750 | $ | 15,750 | $ | - |
| Royal Gold stockholders’ equity | $ | 1,403,716 | $ | 749,441 | $ | 483,217 | $ | 319,081 | $ | 161,660 |
1 The term “free cash flow” is a non-GAAP financial measure. Free cash flow is defined by the Company as operating income plus depreciation, depletion and amortization, non-cash charges and impairment of mining assets, if any, less non-controlling interests in operating income from consolidated subsidiaries. See page 26 for a GAAP reconciliation.
2 Dividends are paid on a calendar year basis and do not correspond with the fiscal year dividend amounts shown in the Selected Financial Data.
3 Net income attributable to Royal Gold shareholders for FY2009 was impacted by two one-time gains related to the Barrick royalty portfolio acquisition and the Benso royalty buy-back by Golden Star. The effect of these gains was $0.62 per basic share after taxes.
4 Net income attributable to Royal Gold shareholders for FY2010 was impacted by pre-tax effects of severance and acquisition costs of $19.4 million, or $0.33 per share, related to the International Royalty Corporation transaction.