- Selected Financial Charts
- Five-year Shareholder Return Comparison
- Selected Financial Data
- Non-GAAP Financial Measures

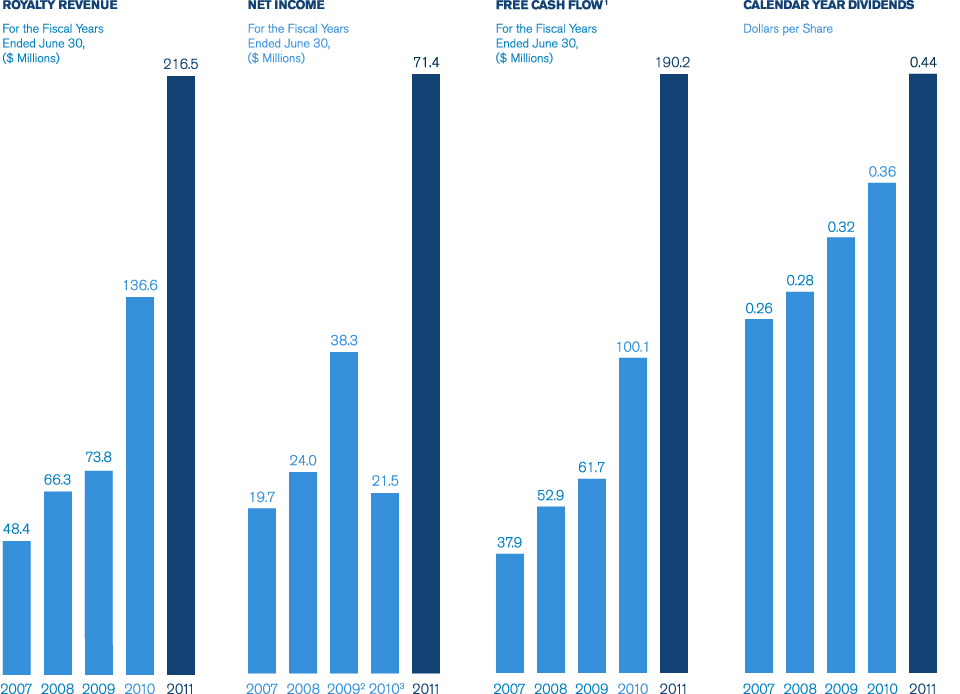
1 The term “free cash flow” is a non-GAAP financial measure. Free cash flow is defined by the Company as operating income plus depreciation, depletion and amortization, non-cash charges and impairment of mining assets, if any, less non-controlling interests in operating income from consolidated subsidiaries. See page 26 for a GAAP reconciliation.
2 Net income attributable to Royal Gold shareholders for FY2009 was impacted by two one-time gains related to the Barrick royalty portfolio acquisition and the Benso royalty buy-back by Golden Star. The effect of these gains was $0.62 per basic share after taxes.
3 Net income attributable to Royal Gold shareholders for FY2010 was impacted by pre-tax effects of severance and acquisition costs of $19.4 million, or $0.33 per share, related to the International Royalty Corporation transaction.

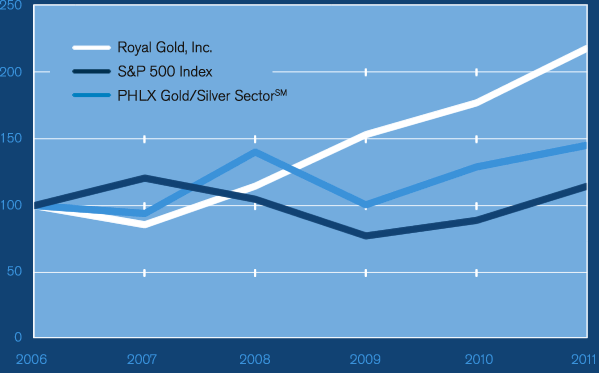
This graph compares the value of the Company’s Common Stock with the value of two stock market indices: Standard and Poor’s 500 Index and the PHLX Gold/Silver Sector IndexSM (XAUSM) as of June 30, 2011. The Company believes that the XAUSM is more representative of the gold mining industry whereas the Standard and Poor’s 500 Index includes only one gold mining company.
PHLX Gold/Silver Sector IndexSM (XAUSM):
Agnico Eagle Mines Limited
AngloGold Ashanti Limited - ADR
Barrick Gold Corporation
Compania Minas Buenaventura - ADR
Freeport-McMoRan Copper & Gold
Gold Fields Limited - ADR
Goldcorp Inc.
Harmony Gold Mining Limited - ADR
Kinross Gold Corporation
Newmont Mining Corporation
Pan American Silver Corporation
Randgold Resources Limited - ADR
Royal Gold, Inc.
Silver Standard Resources Inc.
Silver Wheaton Corporation
Yamana Gold, Inc.
Annual Return Percentage
| Years Ended June 30, | |||||
| Company Name/Index | 2007 | 2008 | 2009 | 2010 | 2011 |
| Royal Gold, Inc. | -13.88 | 33.16 | 34.29 | 16.00 | 23.02 |
| S&P 500 Index | 20.59 | -13.12 | -26.21 | 14.43 | 30.69 |
| PHLX Gold/Silver Sector | -3.85 | 46.32 | -28.87 | 28.73 | 13.38 |
Indexed Returns 1
| Years Ended June 30, | ||||||
| Company Name/Index | Base Period 2006 |
2007 | 2008 | 2009 | 2010 | 2011 |
| Royal Gold, Inc. | 100 | 86.12 | 114.68 | 154.01 | 178.65 | 219.78 |
| S&P 500 Index | 100 | 120.59 | 104.77 | 77.30 | 88.46 | 115.61 |
| PHLX Gold/Silver Sector | 100 | 96.15 | 140.68 | 100.07 | 128.82 | 146.05 |
1 Includes dividend reinvestment.
Selected Statements of Operations Data
| For the Fiscal Years Ended June 30, | ||||||||||
| (Amounts in thousands, except per share data) | 2011 | 2010 | 2009 | 2008 | 2007 | |||||
| Royalty revenue | $ | 216,469 | $ | 136,565 | $ | 73,771 | $ | 66,297 | $ | 48,357 |
| Free cash flow 1 | $ | 190,172 | $ | 100,068 | $ | 61,706 | $ | 52,863 | $ | 37,916 |
| Operating income | $ | 118,925 | $ | 41,035 | $ | 27,292 | $ | 32,982 | $ | 28,506 |
| Net income | $ | 77,299 | $ | 29,422 | $ | 41,357 | $ | 25,395 | $ | 21,242 |
| Net income attributable to Royal Gold stockholders 2, 3 | $ | 71,395 | $ | 21,492 | $ | 38,348 | $ | 24,043 | $ | 19,720 |
| Net income available to Royal Gold common stockholders | $ | 71,395 | $ | 21,492 | $ | 38,348 | $ | 19,255 | $ | 19,720 |
| Net income per share available to Royal Gold common stockholders: | ||||||||||
| Basic | $ | 1.29 | $ | 0.49 | $ | 1.09 | $ | 0.62 | $ | 0.79 |
| Diluted | $ | 1.29 | $ | 0.49 | $ | 1.07 | $ | 0.61 | $ | 0.79 |
| Dividends declared per common share 4 | $ | 0.42 | $ | 0.34 | $ | 0.3 | $ | 0.28 | $ | 0.25 |
Selected Balance Sheet Data
| As of June 30, | ||||||||||
| (Amounts in thousands) | 2011 | 2010 | 2009 | 2008 | 2007 | |||||
| Total assets | $ | 1,902,702 | $ | 1,865,333 | $ | 809,924 | $ | 545,850 | $ | 356,649 |
| Royalty interests in mineral properties, net | $ | 1,690,439 | $ | 1,476,799 | $ | 455,966 | $ | 300,670 | $ | 215,839 |
| Long-term debt, including current portion | $ | 226,100 | $ | 248,500 | $ | 19,250 | $ | 15,750 | $ | 15,750 |
| Royal Gold stockholders’ equity | $ | 1,460,162 | $ | 1,403,716 | $ | 749,441 | $ | 483,217 | $ | 319,081 |
1 The term “free cash flow” is a non-GAAP financial measure. Free cash flow is defined by the Company as operating income plus depreciation, depletion and amortization, non-cash charges and impairment of mining assets, if any, less non-controlling interests in operating income from consolidated subsidiaries. See page 26 for a GAAP reconciliation.
2 Net income attributable to Royal Gold shareholders for FY2010 was impacted by pre-tax effects of severance and acquisition costs of $19.4 million, or $0.33 per share, related to the International Royalty Corporation transaction.
3 Net income attributable to Royal Gold shareholders for FY2009 was impacted by two one-time gains related to the Barrick royalty portfolio acquisition and the Benso royalty buy-back by Golden Star. The effect of these gains was $0.62 per basic share after taxes.
4 Dividends are paid on a calendar year basis, as shown on page 1, and do not correspond with the fiscal year dividend amounts shown in this table.
The Company computes and discloses free cash flow and adjusted EBITDA. Free cash flow and adjusted EBITDA are non-GAAP financial measures. Free cash flow is defined by the Company as operating income plus depreciation, depletion and amortization, non-cash charges, and any impairment of mining assets, less non-controlling interests in operating income of consolidated subsidiaries. Adjusted EBITDA is defined by the Company as net income plus depreciation, depletion and amortization, non-cash charges, income tax expense, interest and other expense, and any impairment of mining assets, less non-controlling interests in operating income of consolidated subsidiaries, interest and other income, and any royalty portfolio restructuring gains. Other companies may define and calculate these measures differently. Management believes that free cash flow and adjusted EBITDA are useful measures of performance of our royalty portfolio. Free cash flow and adjusted EBITDA identify the cash generated in a given period that will be available to fund the Company’s future operations, growth opportunities, shareholder dividends and to service the Company’s debt obligations. Free cash flow and adjusted EBITDA, as defined, are most directly comparable to operating income and net income, respectively, in the Company’s Statements of Operations. Below is a reconciliation of our non-GAAP financial measures:
Free Cash Flow Reconciliation
| For the Fiscal Years Ended June 30, | ||||||||||
| (Unaudited, in thousands) | 2011 | 2010 | 2009 | 2008 | 2007 | |||||
| Operating income | $ | 118,925 | $ | 41,035 | $ | 27,292 | $ | 32,982 | $ | 28,506 |
| Depreciation, depletion and amortization | 67,399 | 53,793 | 32,578 | 18,364 | 8,269 | |||||
| Non-cash employee stock compensation | 6,494 | 7,279 | 2,921 | 2,869 | 2,663 | |||||
| Non-controlling interests in operating | ||||||||||
| income of consolidated subsidiaries | -2,646 | -2,039 | -1,085 | -1,352 | -1,522 | |||||
| Free cash flow | $ | 190,172 | $ | 100,068 | $ | 61,706 | $ | 52,863 | $ | 37,916 |
Adjusted EBITDA Reconciliation
| For the Fiscal Years Ended June 30, | ||||||||||
| (Unaudited, in thousands) | 2011 | 2010 | 2009 | 2008 | 2007 | |||||
| Net income | $ | 77,299 | $ | 29,422 | $ | 41,357 | $ | 25,395 | $ | 21,242 |
| Interest and other expense | 7,740 | 3,809 | 984 | 1,729 | 1,973 | |||||
| Interest and other income | -5,088 | -6,360 | -3,192 | -6,742 | -4,258 | |||||
| Income tax expense | 38,974 | 14,164 | 21,857 | 12,050 | 9,549 | |||||
| Depreciation, depletion and amortization | 67,399 | 53,793 | 32,578 | 18,364 | 8,269 | |||||
| Royalty portfolio restructuring gain | - | - | -33,714 | - | - | |||||
| Loss from equity investment | - | - | - | 550 | - | |||||
| Non-cash employee stock compensation | 6,494 | 7,279 | 2,921 | 2,869 | 2,663 | |||||
| Non-controlling interests in operating income of consolidated subsidiaries | -2,646 | -2,039 | -1,085 | -1,352 | -1,522 | |||||
| Adjusted EBITDA | $ | 190,172 | $ | 100,068 | $ | 61,706 | $ | 52,863 | $ | 37,916 |